

Today, three seconds before the close, someone was in a desperate hurry to
dump 60,000 E-Mini contracts - the equivalent of $4.1 billion in underlying
notional (ignoring the reflexive impact on various correlated assets and
downstream synthetic instruments like ETFs and options). What happened next was
a trade that was just shy of the size of the Waddell and Reed trade that the SEC
said caused the flash crash. Luckily this time there was just 3 seconds of
potential waterfall after-effects before the market closed. Had this happened at
the May 6 blue light special time of 2:30 pm, the month end marks of US hedge
funds and prop desks would have looked very different one day before the all too
critical FOMC statement. The question remains: who waited to perform a reverse
E-bay (inverse bid all in, in the last second of trading), and just what do/did
they know? Below we present the complete 60,000 dump in its full visual glory
courtesy of Nanex. But hold
on. There is a twist...
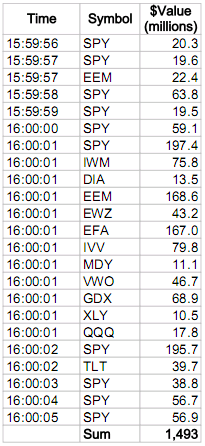
From Nanex: eMini Wipe-out
On July 31, 2012, starting about 3 seconds before the close (15:59:57 EDT), our monitoring software alerted us to an unusually large trade of over 60,000 eMini (ES September 2012) contracts that were sold at once. At the same time, we also received an alert showing large and unusual trades in ETFs (note the last column is the value of the trade in millions of dollars):
* * *
And where things get really interesting, is that what happened a few short hours ago, is virtually a carbon copy replica of an almost identical event which took place on July 31... 2011
On July 29, 2011, also the last trading day of July, Nanex noticed a eerily similar event and published a paper on it. A chart of SPY on that day is shown below.
From Nanex: eMini Wipe-out
On July 31, 2012, starting about 3 seconds before the close (15:59:57 EDT), our monitoring software alerted us to an unusually large trade of over 60,000 eMini (ES September 2012) contracts that were sold at once. At the same time, we also received an alert showing large and unusual trades in ETFs (note the last column is the value of the trade in millions of dollars):
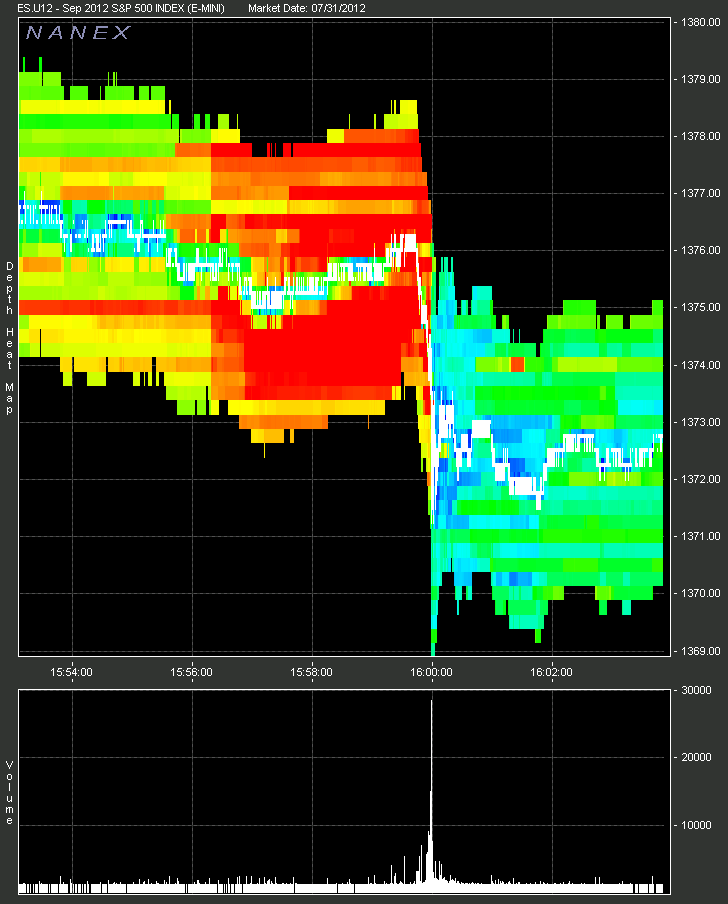
 1. eMini depth of chart showing price map in the upper panel, and trade volume volume as a histogram below. |
 |
|
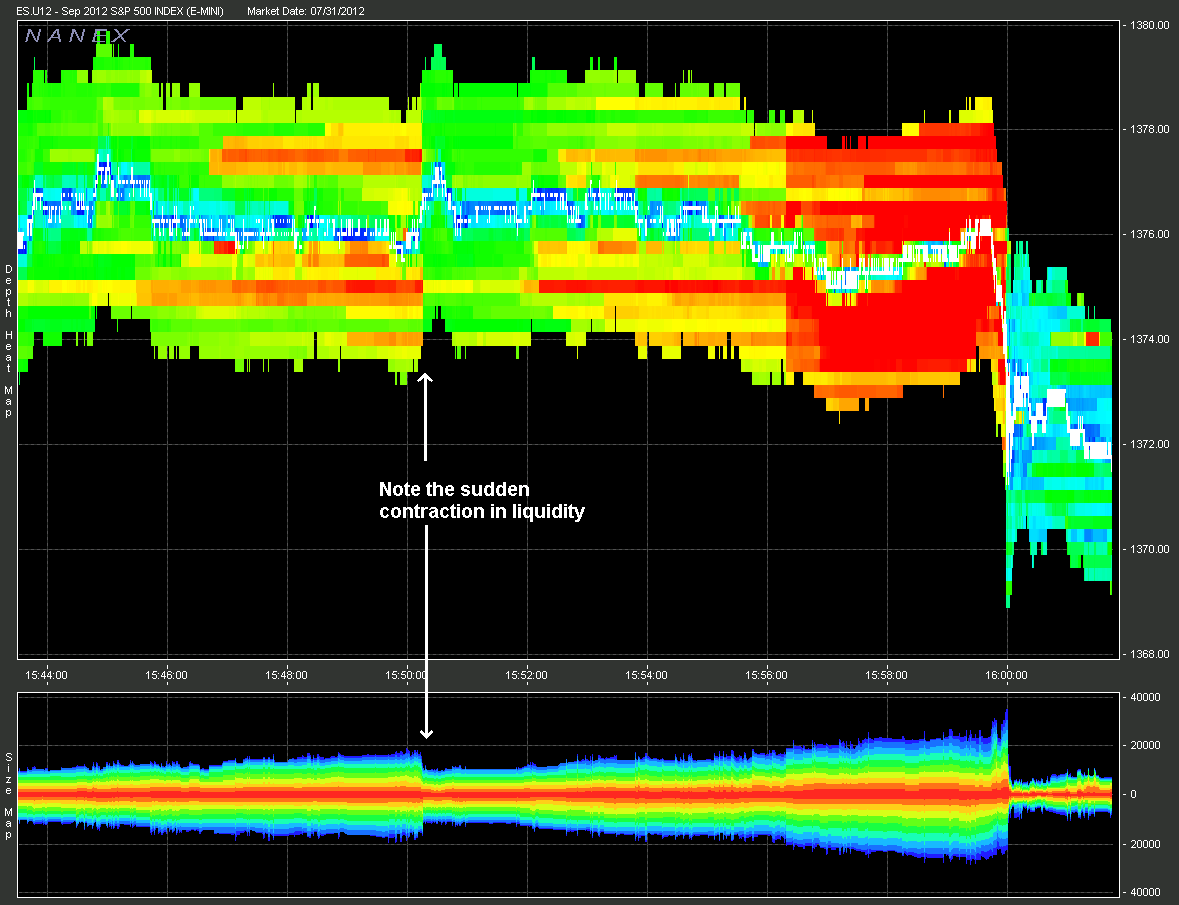
2. eMini Depth of chart showing price and size map. |
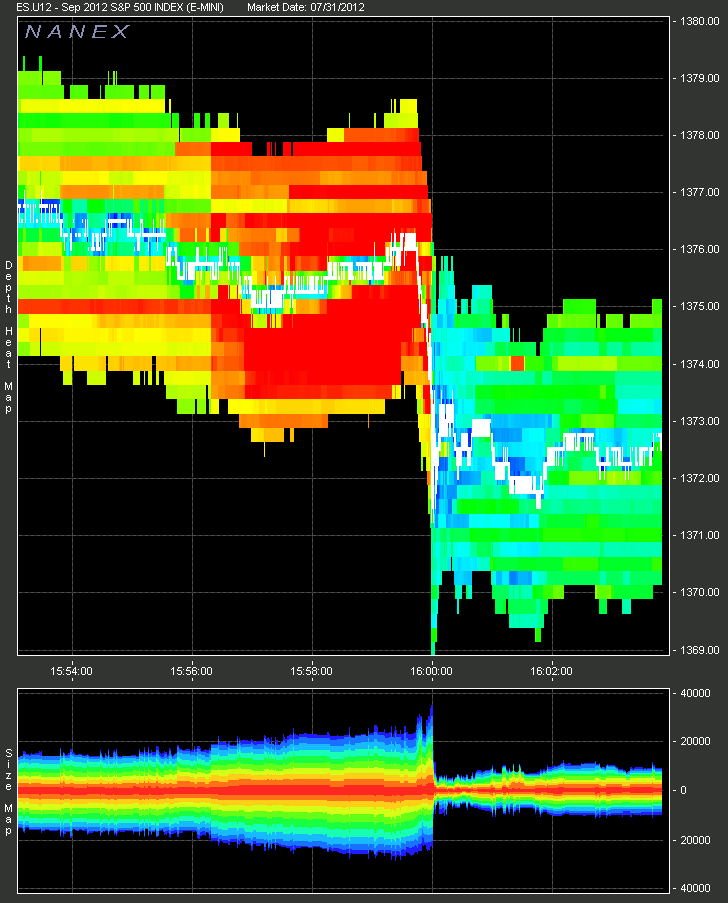 |
| At 15:50:15, we noticed a sudden drop in eMini liquidity. Note the sudden contraction just to the left of center. | |
 |
* * *
And where things get really interesting, is that what happened a few short hours ago, is virtually a carbon copy replica of an almost identical event which took place on July 31... 2011
On July 29, 2011, also the last trading day of July, Nanex noticed a eerily similar event and published a paper on it. A chart of SPY on that day is shown below.
No comments:
Post a Comment