Submitted by Tyler Durden on
03/21/2012 19:45 -0400
There was a time when catching the silver "whack-a-mole" algo, or process, or
intervention, or manipulation, or whatever one wants to call it, in action was a
myth: an urban legend, perpetuated by silver conspiracy theorists. Until today
that is. Courtesy of Nanex we now have direct evidence of just what the
reflexive market (in which derivative products such as ETFs influence underlying
assets) goes to town by taking silver to the woodshed at a whopping 75,000 times
per second! From the broken market sleuths at Nanex: "On March 20, 2012 at
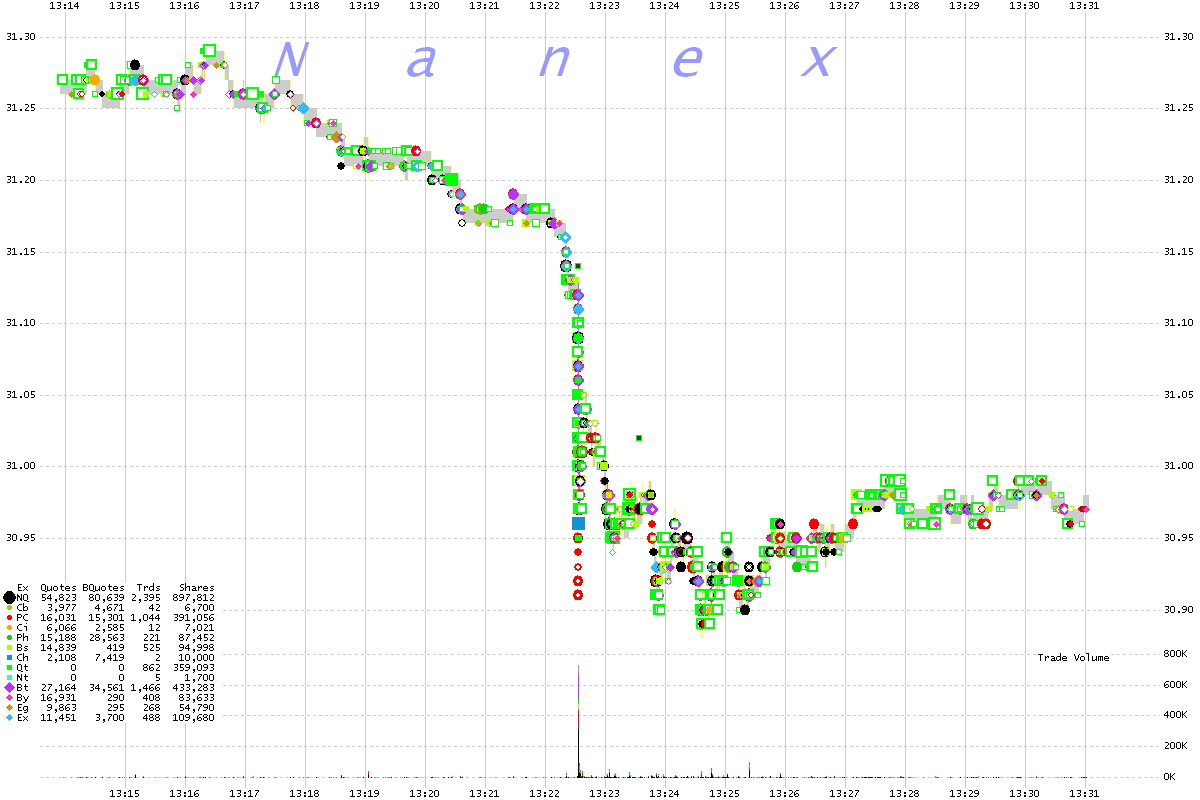
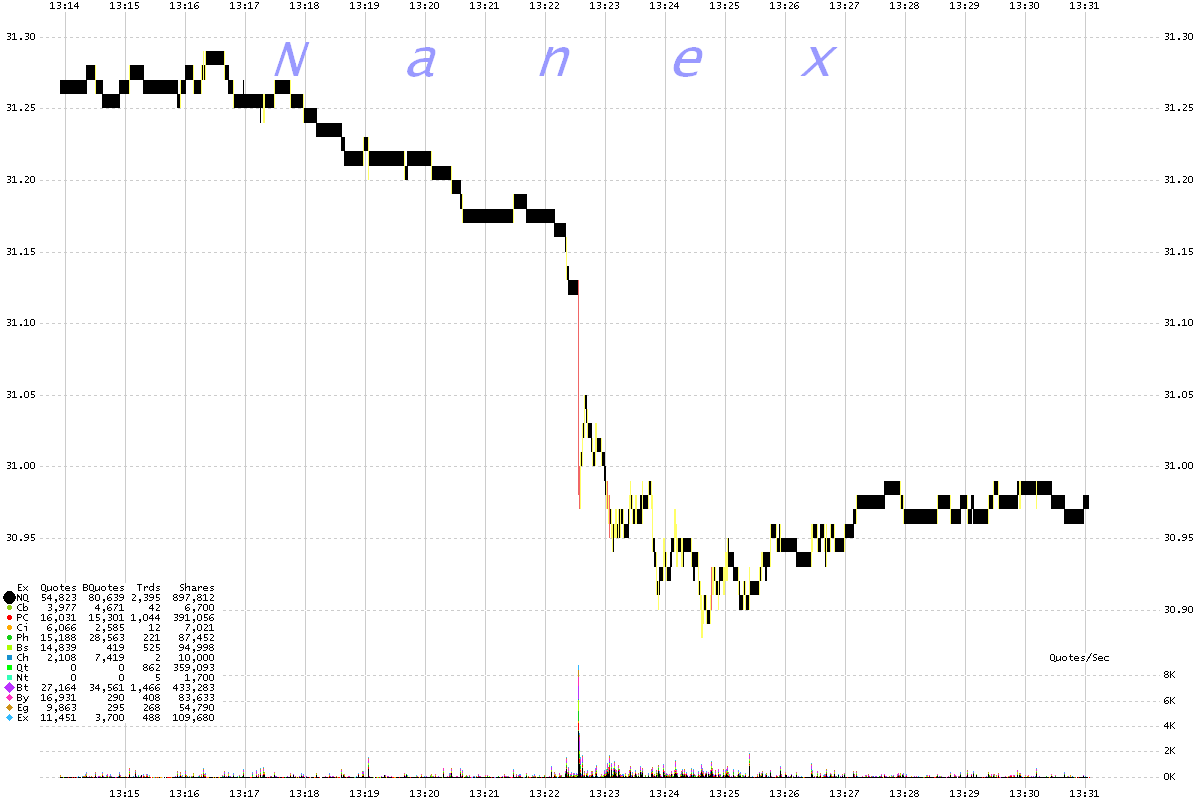
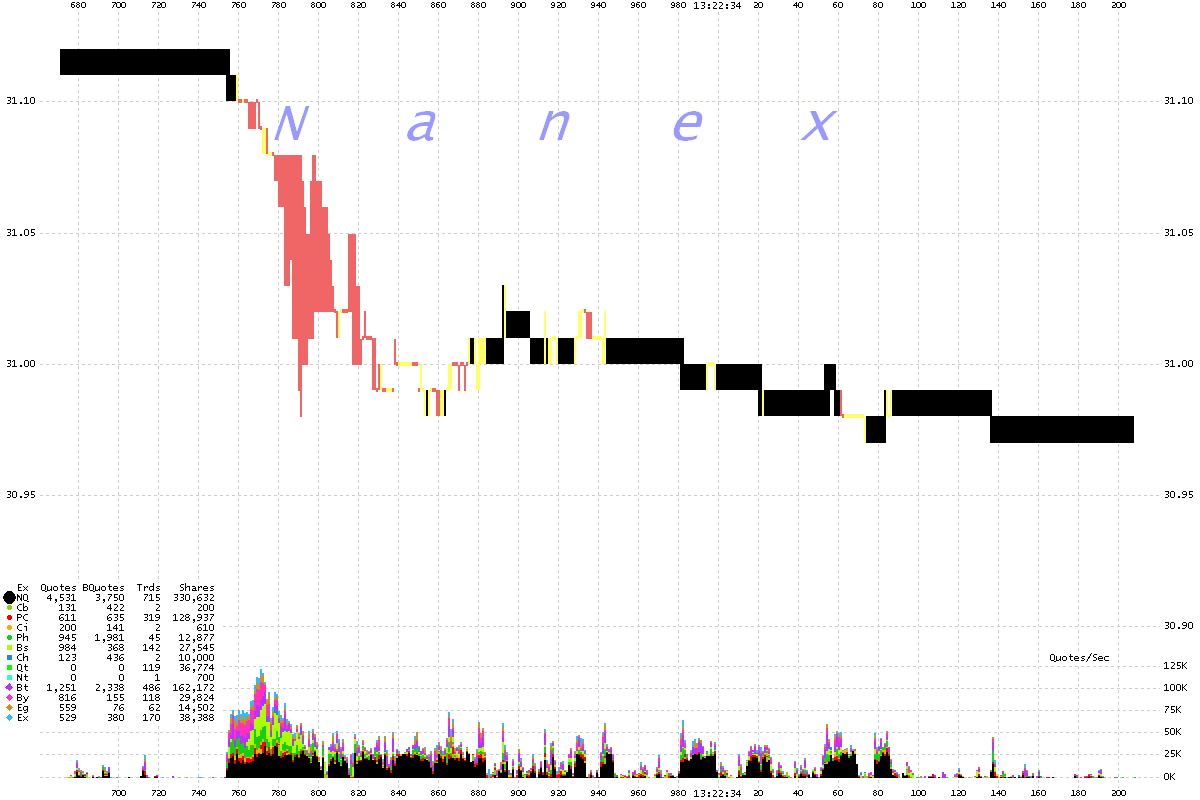
13:22:33, the quote rate in the ETF symbol SLV sustained a rate
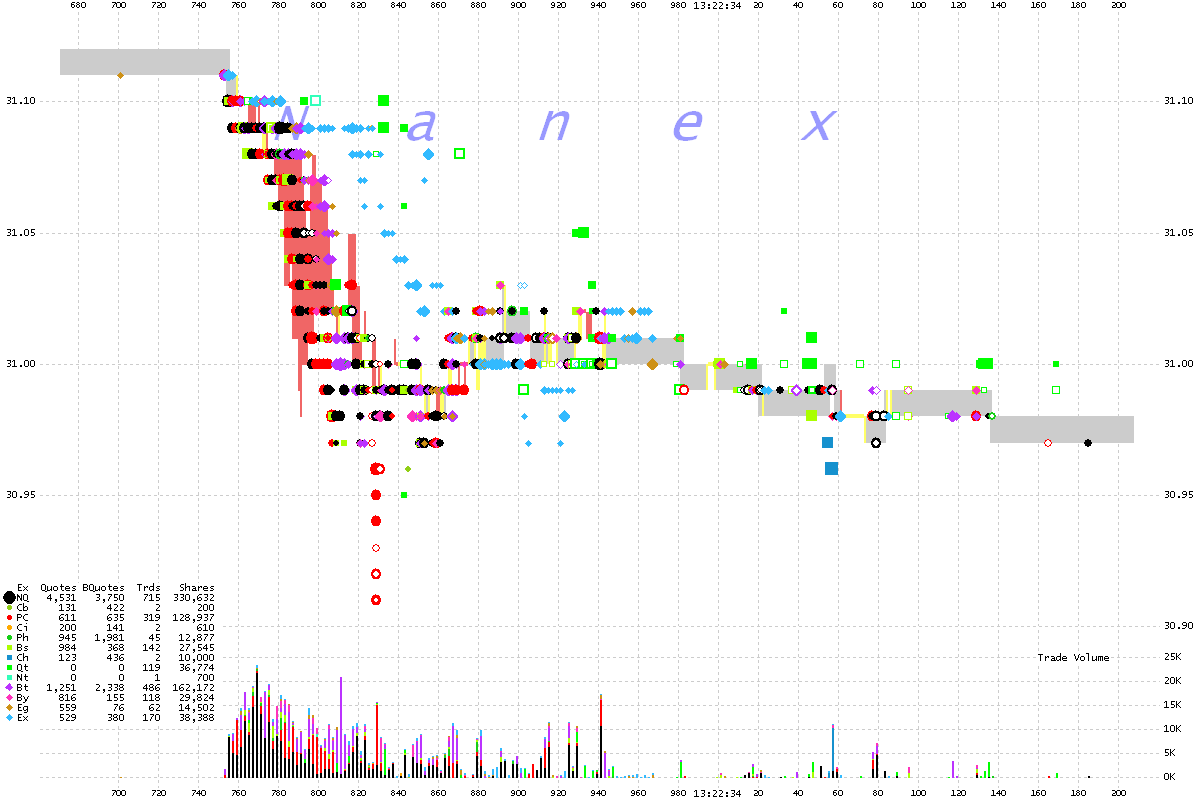
exceeding 75,000/sec (75/ms) for 25 milliseconds. Nasdaq quotes lagged
other exchanges by about 50 milliseconds. Nasdaq quotes even lagged
their own trades -- a condition we have jokingly referred to as fantaseconds."
Translation: so desperate was the desire to crush silver at precisely 13:22;33,
that the Nasdaq order flow directive ended up moving faster than light. Frankly,
we don't know about you, but when someone is willing to bend the laws of
relativity, just to get a cheaper price in silver, to perpetuate a failing
monetary system or for any other reason, we quietly step aside...
From Nanex:
SLV 1 second interval chart showing trades colored by reporting exchange.
SLV 1 second interval chart showing the NBBO
Shaded black if normal, yellow if locked (bid = ask) or red if crossed (bid > ask).
SLV 1 millisecond interval chart showing trades colored by reporting exchange.
Chart shows about 200 milliseconds of time.
SLV 1 millisecond interval chart showing the NBBO
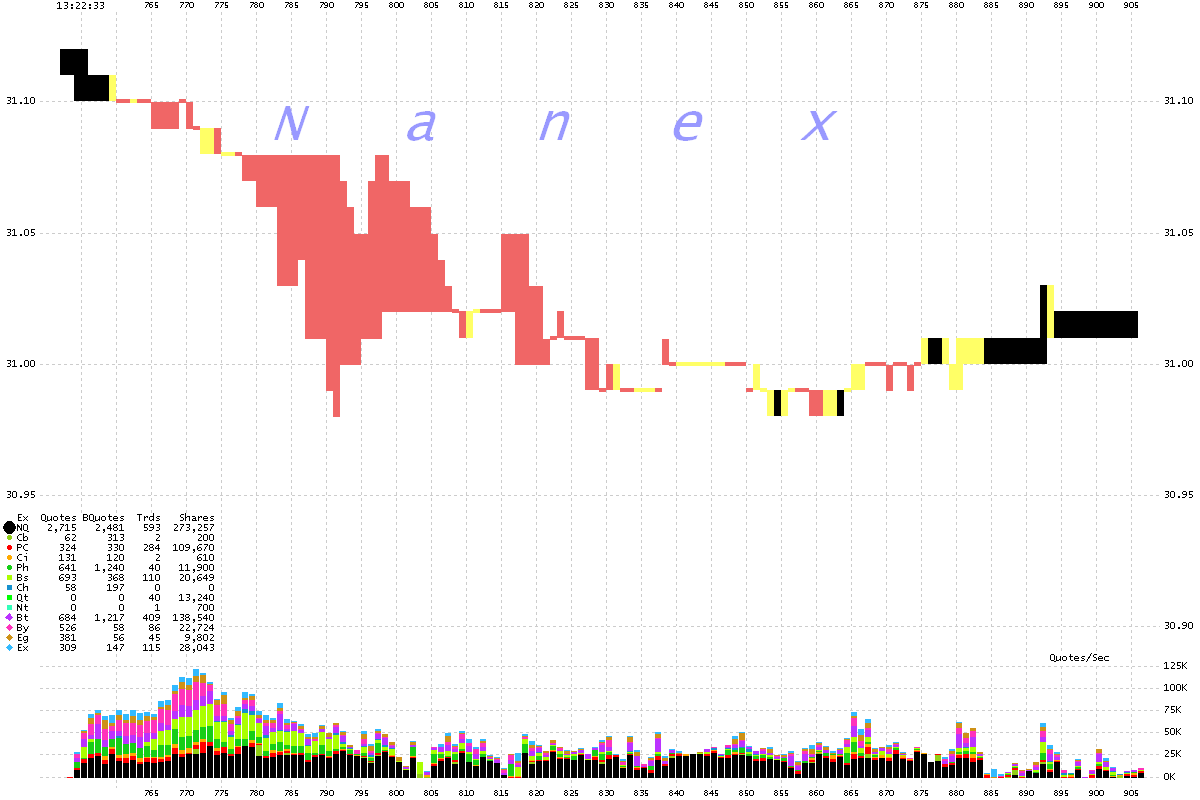
Shaded black if normal, yellow if locked (bid = ask) or red if crossed (bid > ask). Note the insanely high quote rate in the bottom panel. Chart shows about 200 milliseconds of time.
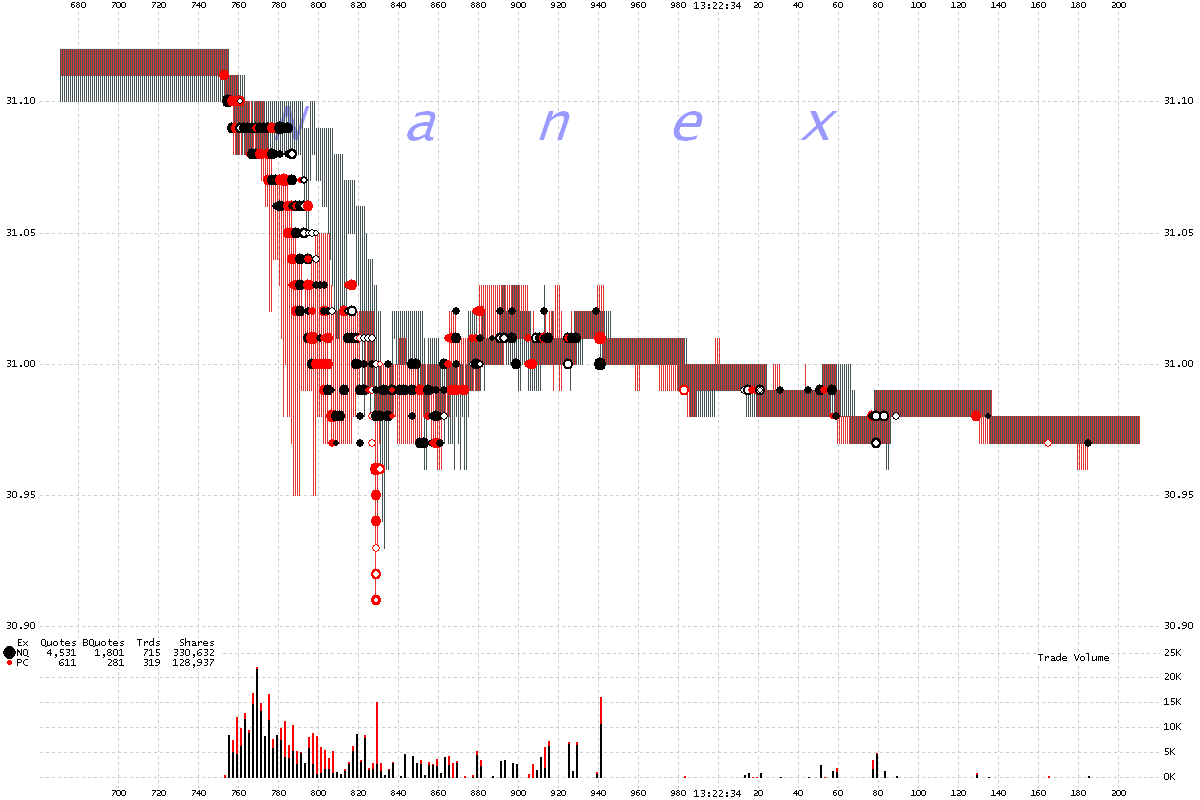
SLV 1 millisecond interval chart showing the quotes and trades from ARCA (red) and Nasdaq (black).You can clearly see the delay in Nasdaq quotes, yet their trades aren't delayed at all. Chart shows about 200 milliseconds of time.
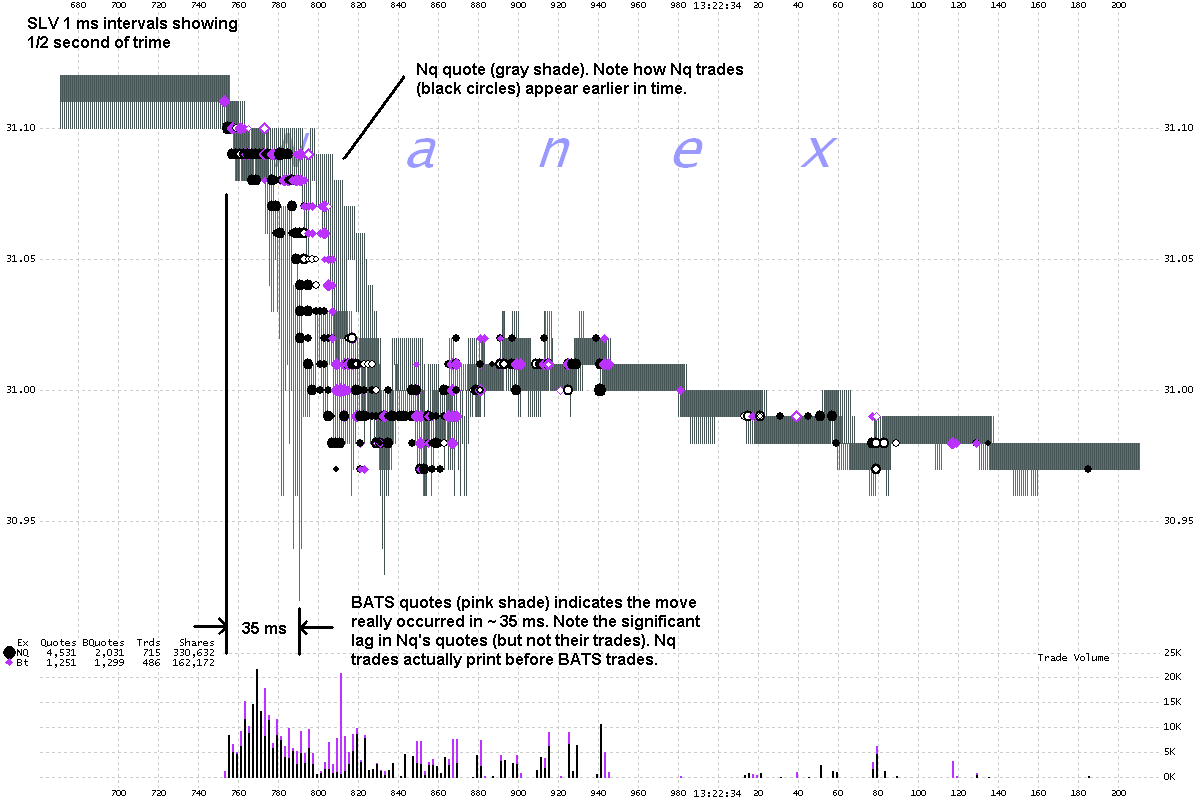
SLV 1 millisecond interval chart showing the quotes and trades from BATS (purple) and Nasdaq (black).You can clearly see the delay in Nasdaq quotes, yet their trades aren't delayed at all. Chart shows about 200 milliseconds of time.
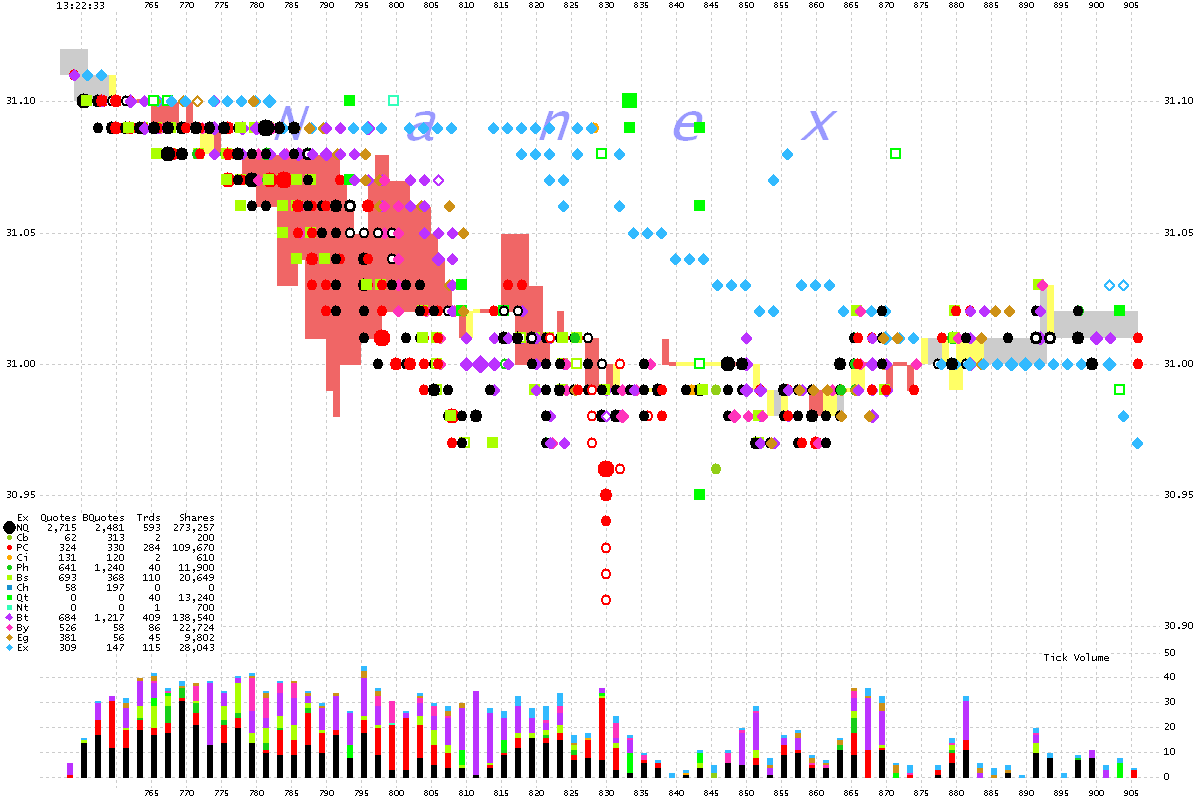
SLV 1 millisecond interval chart showing trades colored by reporting exchange.
This chart shows approximately 150 milliseconds of time.
SLV 1 millisecond interval chart showing the NBBO.This chart shows approximately 150 milliseconds of time.
From Nanex:
SLV 1 second interval chart showing trades colored by reporting exchange.

SLV 1 second interval chart showing the NBBO
Shaded black if normal, yellow if locked (bid = ask) or red if crossed (bid > ask).

SLV 1 millisecond interval chart showing trades colored by reporting exchange.
Chart shows about 200 milliseconds of time.

SLV 1 millisecond interval chart showing the NBBO
Shaded black if normal, yellow if locked (bid = ask) or red if crossed (bid > ask). Note the insanely high quote rate in the bottom panel. Chart shows about 200 milliseconds of time.

SLV 1 millisecond interval chart showing the quotes and trades from ARCA (red) and Nasdaq (black).You can clearly see the delay in Nasdaq quotes, yet their trades aren't delayed at all. Chart shows about 200 milliseconds of time.

SLV 1 millisecond interval chart showing the quotes and trades from BATS (purple) and Nasdaq (black).You can clearly see the delay in Nasdaq quotes, yet their trades aren't delayed at all. Chart shows about 200 milliseconds of time.

SLV 1 millisecond interval chart showing trades colored by reporting exchange.
This chart shows approximately 150 milliseconds of time.

SLV 1 millisecond interval chart showing the NBBO.This chart shows approximately 150 milliseconds of time.


No comments:
Post a Comment