Submitted by Tyler Durden on 03/01/2012 19:13 -0500
When reporting on yesterday's bizarre market action, which in addition to criss-crossing the DJIA 13,000K a total of almost 70 times in the past 4 days, saw some very curious fireworks throughout the day, we noted a very curious sell off in stocks in the last second of trading, which we jokingly (or so we thought) claimed was another flash crash. As it turns out, the move may indeed have been a mini flash crash, with all the salient features exhibited by the market on that fateful day in May 2010 when the DJIA plunged by 1000 points in seconds. Nanex, which unlike the SEC, is eager to explain and unearth strange and unexpected market moves, has performed a forensic analysis on this data, and has uncovered the same quote dissemination delay that occured during the Flash Crash, only this time not in the NYSE, but on the Nasdaq. Which, in turn should answer readers' questions whether any exchange is safe (if anyone were to care to find out the answer), aside from Sizma X of course.
From Nanex:
SPY Closing Event of February 29, 2012
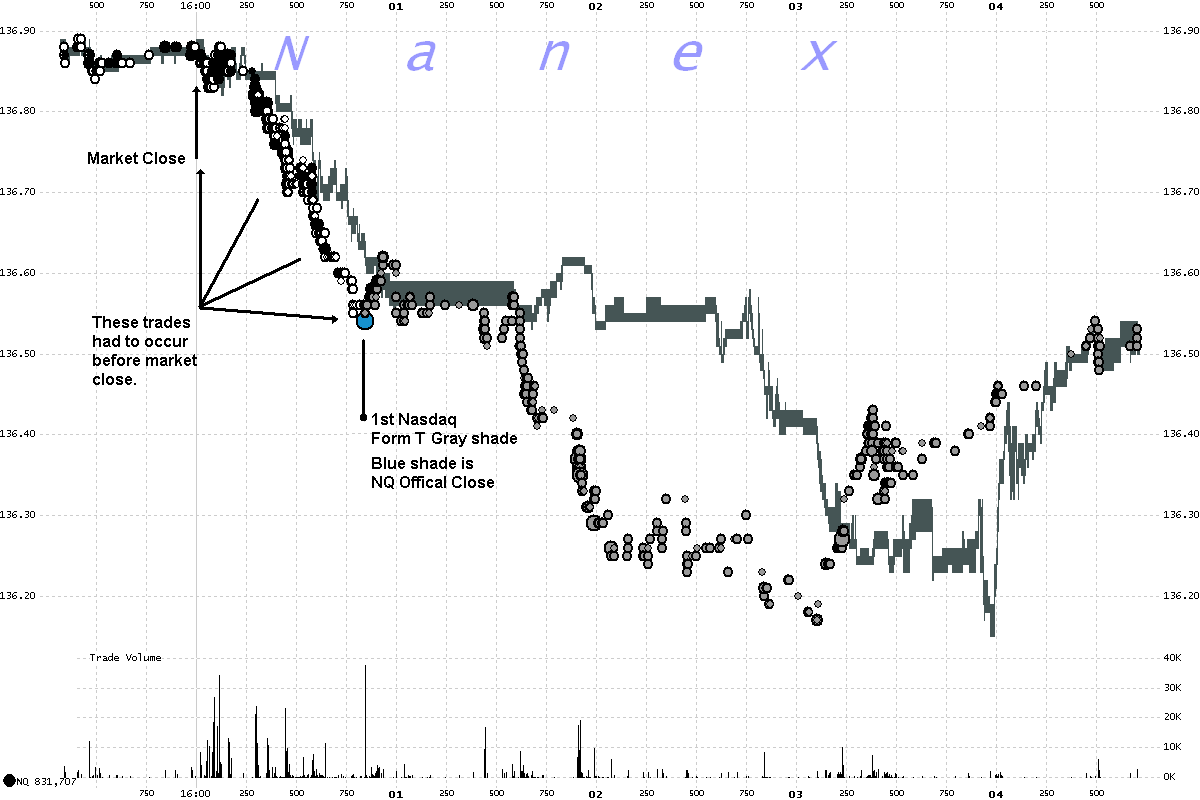
During the market close in SPY on February 29, 2012, a delay of about 1.25 seconds developed in quotes from Nasdaq relative to quotes from other exchanges. Execution trade prices from Nasdaq appeared synchronous with trade prices from other exchanges, which shouldn't be possible, since Nasdaq's quote was behind. We also noticed an anomaly in the trade condition.
The trade condition Form-T is used to indicate trades that executed before or after regular trading hours (9:30-16:00 Eastern). What is puzzling is that the first Nasdaq trades marked Form-T don't appear for almost a full second after the close. Right along side the Nasdaq trades marked ISO or regular are trades with the same prices from other exchanges, but marked Form-T. We've become used to seeing Nasdaq trades printing ahead of their quotes because it's so common (yet impossible unless routing is based on direct feeds instead of the SIP). But we're not sure how the trade condition could get time-warped like that. How is it that trades from Nasdaq between 16:00:00 and 16:00:00.841 are not marked Form-T, yet have the same prices as trades from other exchanges which are marked Form-T? It's as if the prices are not delayed, but the conditions are. What is going on here?
Update March 1, 2012
We now believe that Nasdaq trades with timestamps between 16:00:00.000 and 16:00:00.841 and marked regular or ISO occurred before 16:00:00.000. Which means the quote delay was at least 841 milliseconds longer than originally thought. This still does not cleanly explain how trades from other exchanges with similar prices were marked with the Form-T condition (indicating after close).
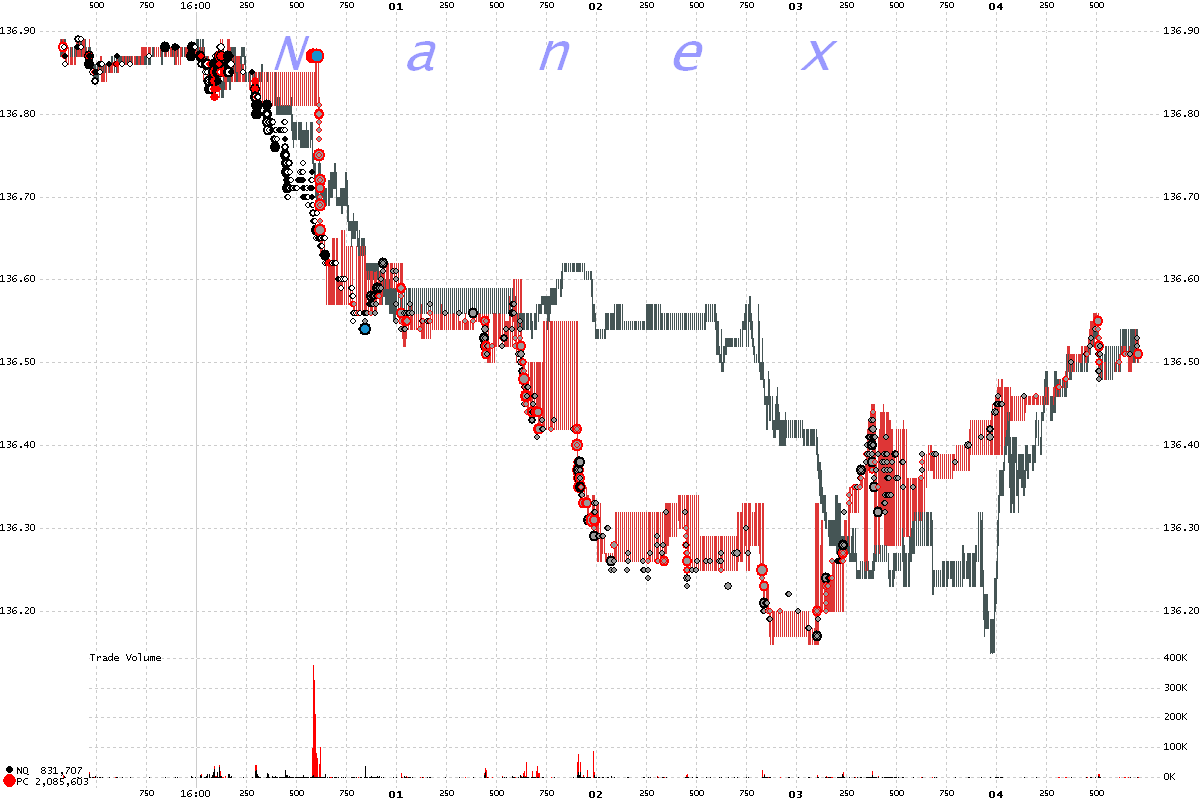
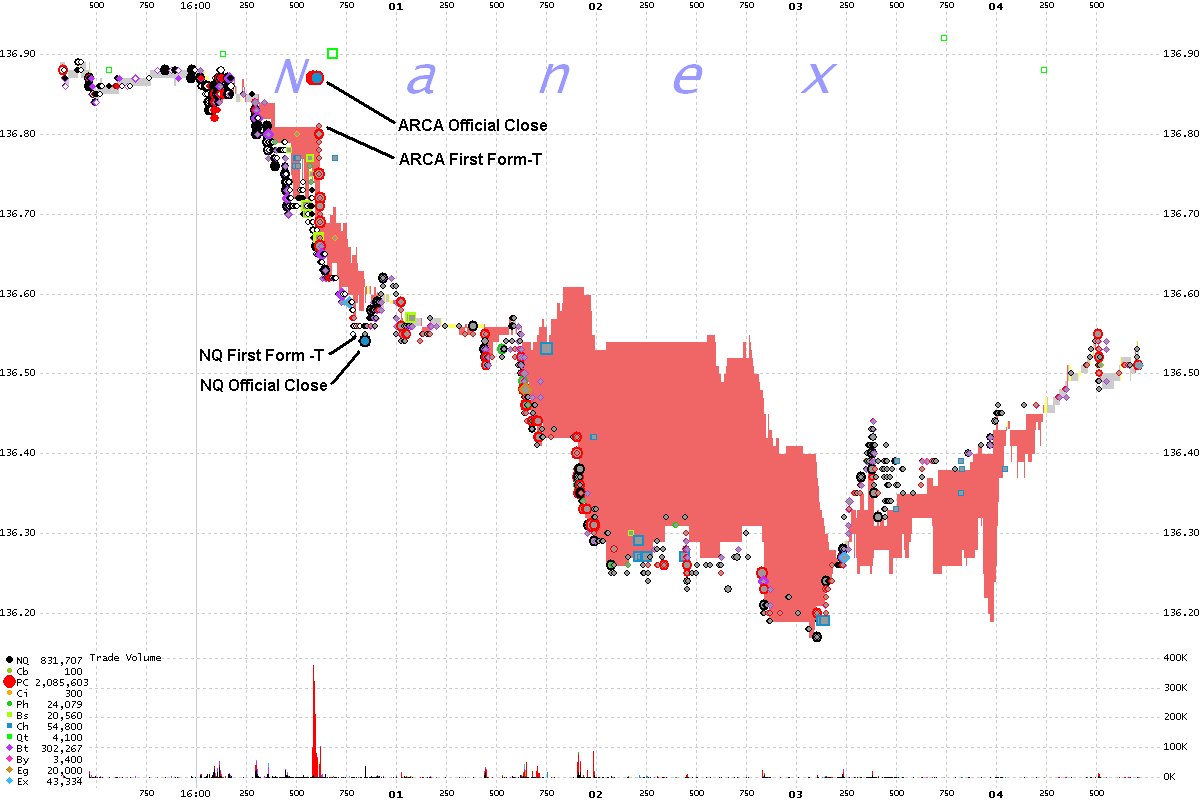
Another mystery is the source of the closing price of 137.02. We found trades with the condition Official Market Center Close on ARCA at 136.87 and Nasdaq at 136.54.
SPY 5, 10 and 100 millisecond interval charts.
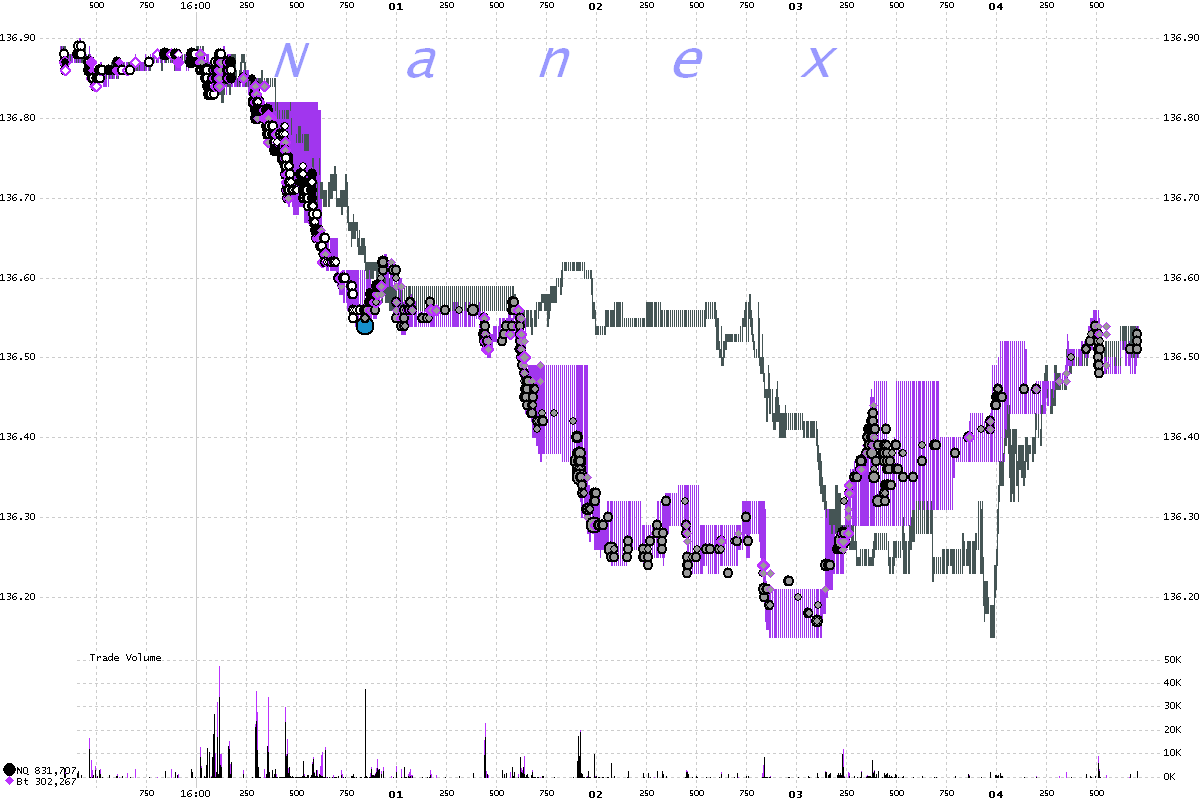
Shaded area represents Bid/Ask spread, circles represent trades. Note how far Nasdaq's quote gets behind BATS's quote, yet Nasdaq Trades are not affected (except for the trade condition).
1. NQ quotes (shaded) and trades (circles). 5 ms. Quote and trade prices should be aligned, but you can see the quote shifting to the right.
2. NQ and BATS quotes and trades. 5 ms
3. NQ and ARCA quotes and trades. 5 ms
4. NBBO and trades from all exchanges. The red shading (NBBO crossed) indicates the magnitude of the delay. 5 ms
5. NQ and BATS quotes and trades. 10ms
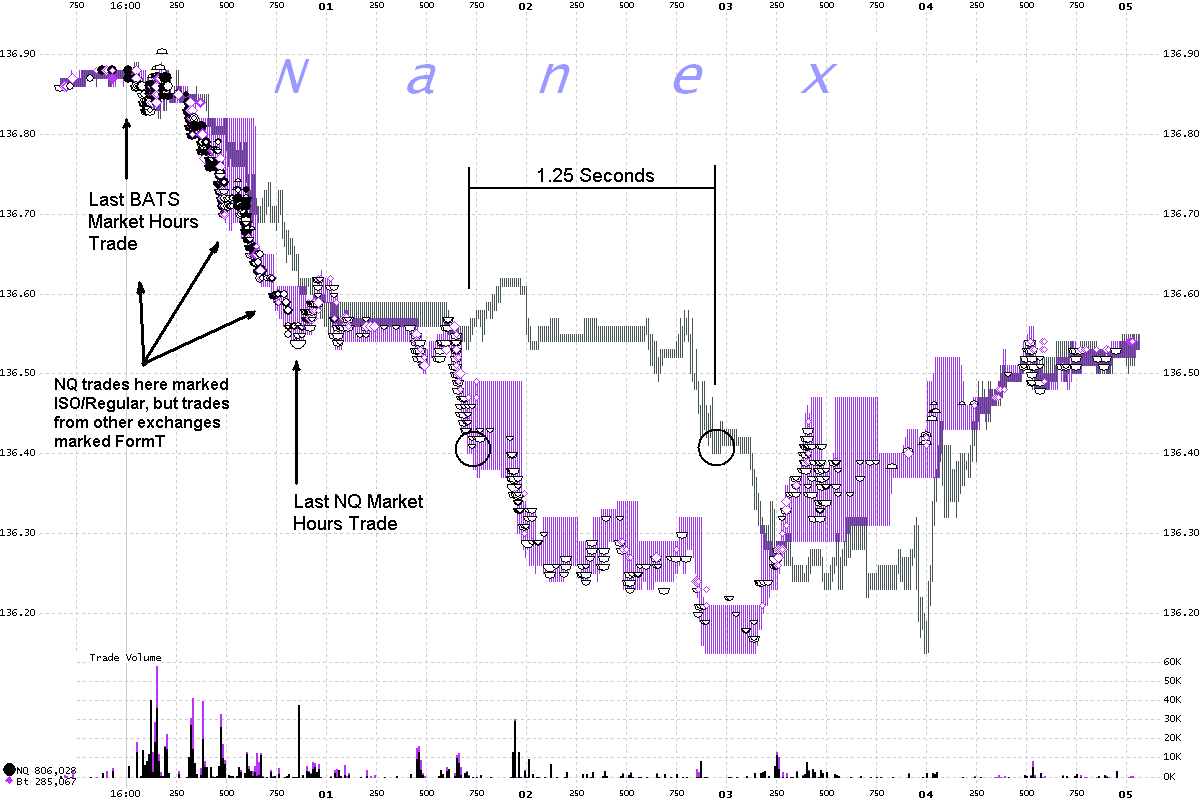
6. NQ quotes and trades. 10ms
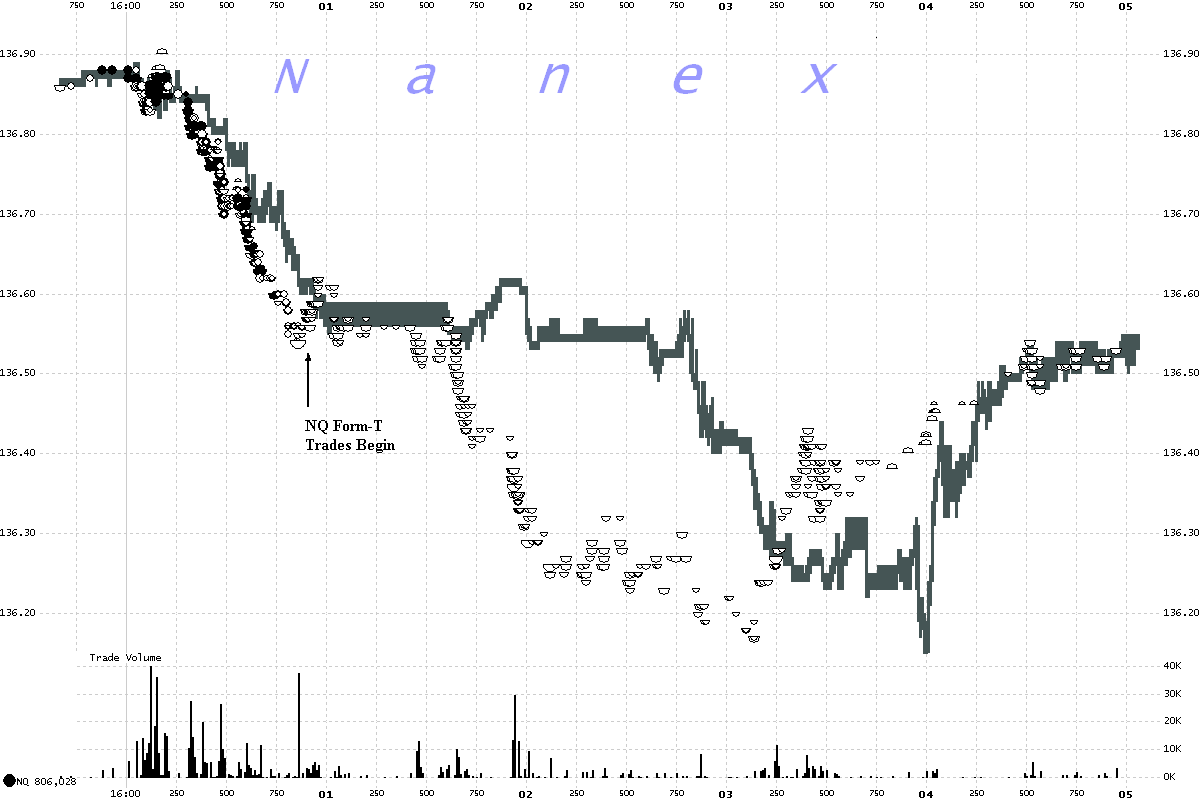
7. BATS quotes and trades. 10ms
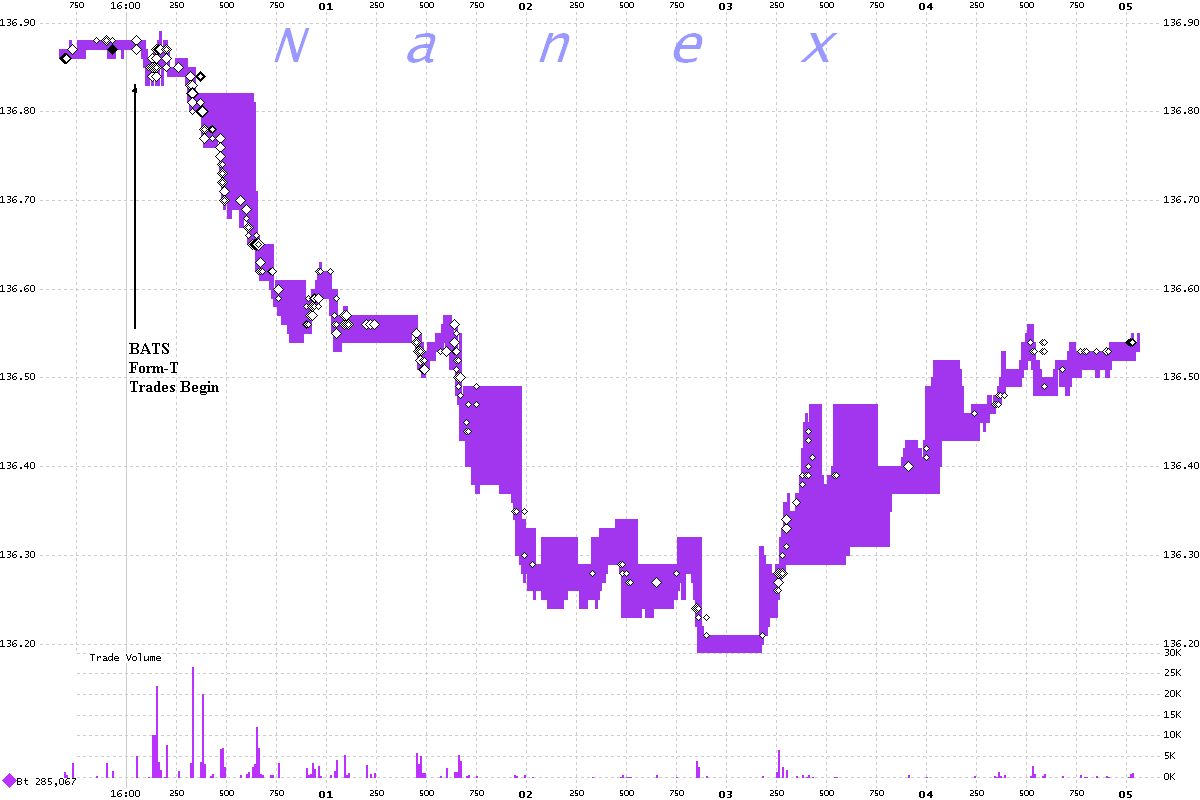
8. NQ and BATS quotes. 10ms
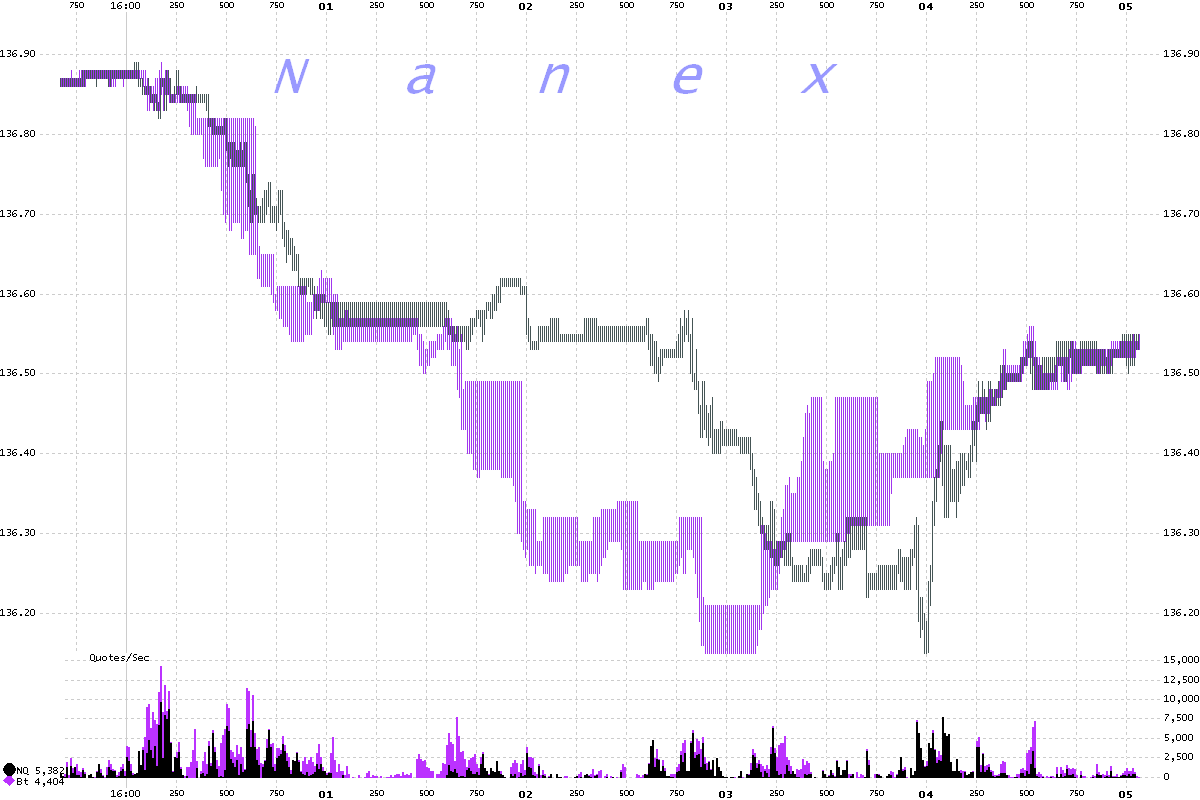
9. NQ and ARCA quotes and trades. 10ms
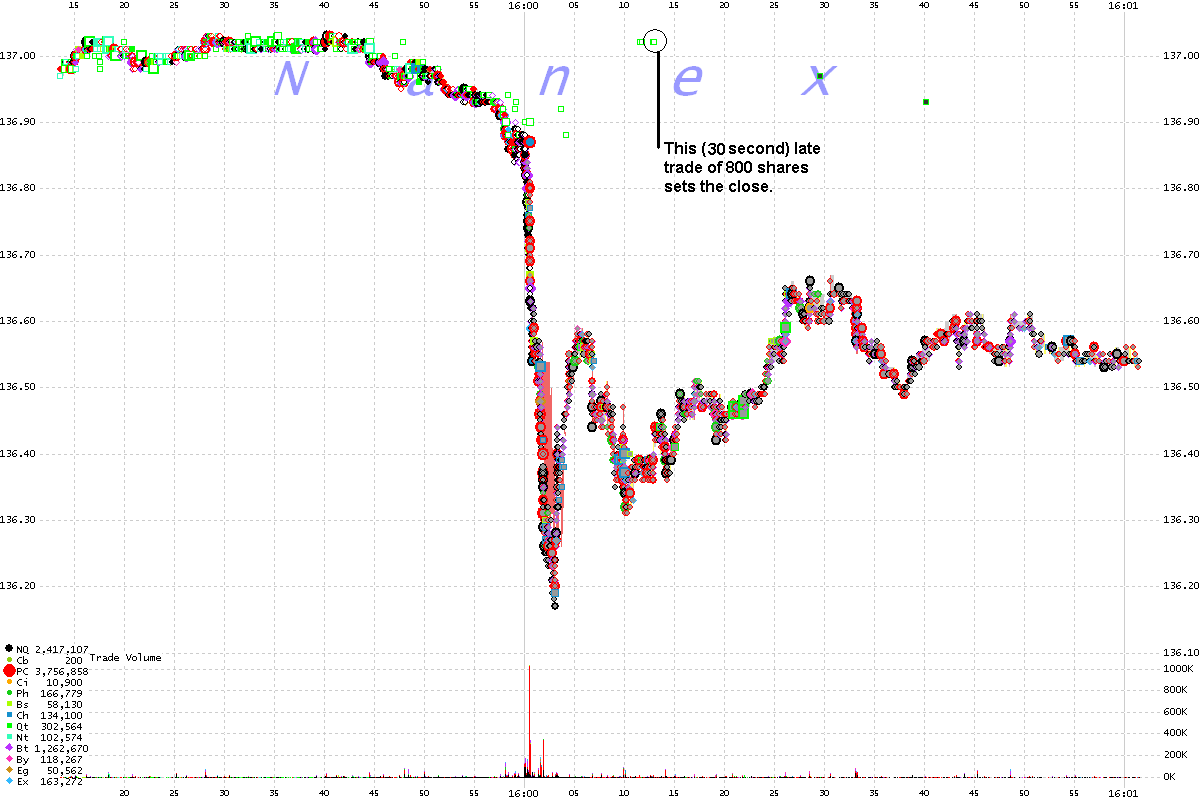
10. NBBO and trades from all exchanges. 100ms
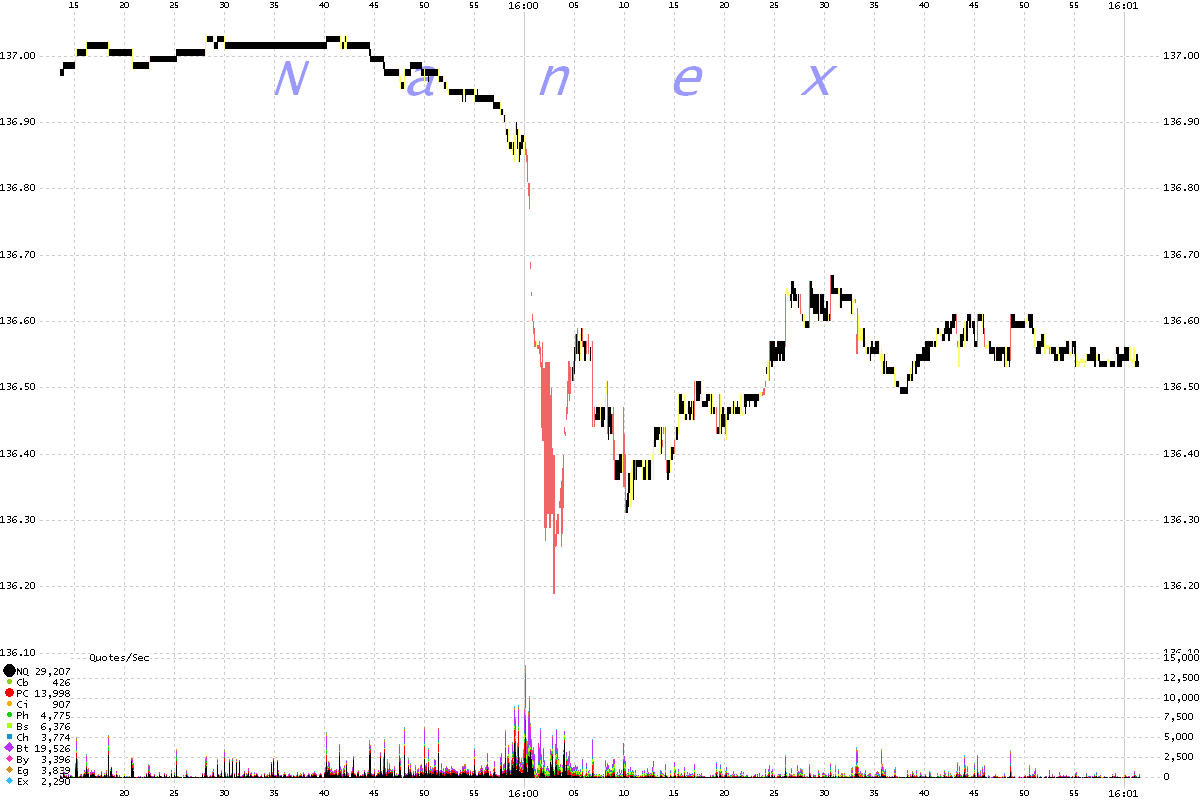
11. The NBBO (normal market: black, locked: yellow, crossed: red). 100ms
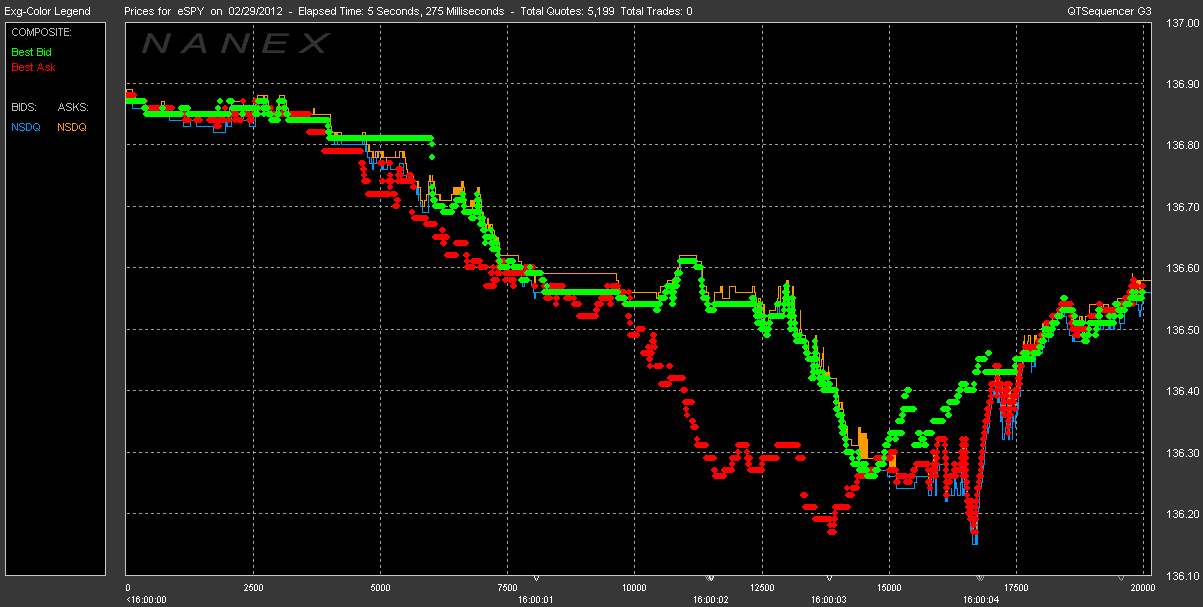
12. Best bid and offer becomes severely crossed due to the delayed NQ quote.
In the grand scheme of things, all of this is irrelevant. Remember: no matter what anyone says, everyone will be able to sell ahead of everyone else when the dump ultimately comes. Guaranteed.
From Nanex:
SPY Closing Event of February 29, 2012
During the market close in SPY on February 29, 2012, a delay of about 1.25 seconds developed in quotes from Nasdaq relative to quotes from other exchanges. Execution trade prices from Nasdaq appeared synchronous with trade prices from other exchanges, which shouldn't be possible, since Nasdaq's quote was behind. We also noticed an anomaly in the trade condition.
The trade condition Form-T is used to indicate trades that executed before or after regular trading hours (9:30-16:00 Eastern). What is puzzling is that the first Nasdaq trades marked Form-T don't appear for almost a full second after the close. Right along side the Nasdaq trades marked ISO or regular are trades with the same prices from other exchanges, but marked Form-T. We've become used to seeing Nasdaq trades printing ahead of their quotes because it's so common (yet impossible unless routing is based on direct feeds instead of the SIP). But we're not sure how the trade condition could get time-warped like that. How is it that trades from Nasdaq between 16:00:00 and 16:00:00.841 are not marked Form-T, yet have the same prices as trades from other exchanges which are marked Form-T? It's as if the prices are not delayed, but the conditions are. What is going on here?
Update March 1, 2012
We now believe that Nasdaq trades with timestamps between 16:00:00.000 and 16:00:00.841 and marked regular or ISO occurred before 16:00:00.000. Which means the quote delay was at least 841 milliseconds longer than originally thought. This still does not cleanly explain how trades from other exchanges with similar prices were marked with the Form-T condition (indicating after close).
Another mystery is the source of the closing price of 137.02. We found trades with the condition Official Market Center Close on ARCA at 136.87 and Nasdaq at 136.54.
SPY 5, 10 and 100 millisecond interval charts.
Shaded area represents Bid/Ask spread, circles represent trades. Note how far Nasdaq's quote gets behind BATS's quote, yet Nasdaq Trades are not affected (except for the trade condition).
1. NQ quotes (shaded) and trades (circles). 5 ms. Quote and trade prices should be aligned, but you can see the quote shifting to the right.

2. NQ and BATS quotes and trades. 5 ms

3. NQ and ARCA quotes and trades. 5 ms

4. NBBO and trades from all exchanges. The red shading (NBBO crossed) indicates the magnitude of the delay. 5 ms

5. NQ and BATS quotes and trades. 10ms

6. NQ quotes and trades. 10ms

7. BATS quotes and trades. 10ms

8. NQ and BATS quotes. 10ms

9. NQ and ARCA quotes and trades. 10ms

10. NBBO and trades from all exchanges. 100ms

11. The NBBO (normal market: black, locked: yellow, crossed: red). 100ms

12. Best bid and offer becomes severely crossed due to the delayed NQ quote.

In the grand scheme of things, all of this is irrelevant. Remember: no matter what anyone says, everyone will be able to sell ahead of everyone else when the dump ultimately comes. Guaranteed.


No comments:
Post a Comment